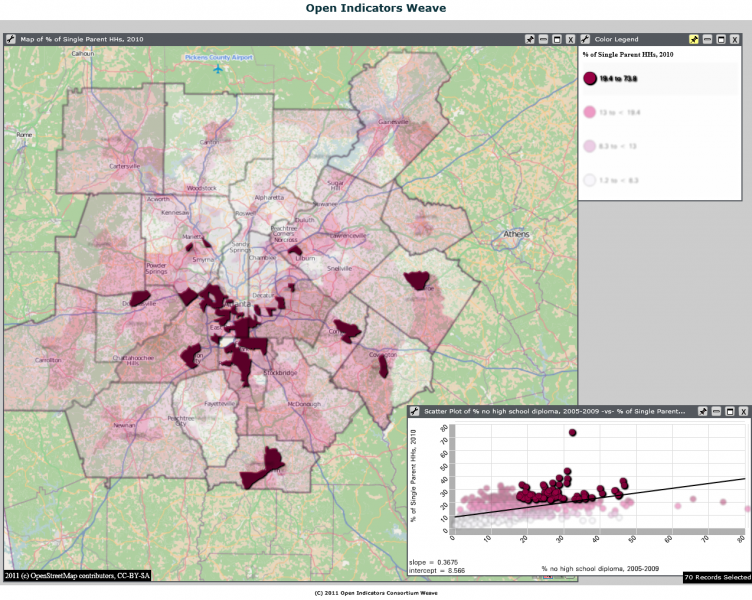
A scatterplot is a map that displays the values for a set of data. In this particular map it shows a relationship between single parents and education. This map does a good job of showing the view the difference between the two data so you can distinguish a pattern. It uses small dots to point out the areas where the data is collected.
No comments:
Post a Comment